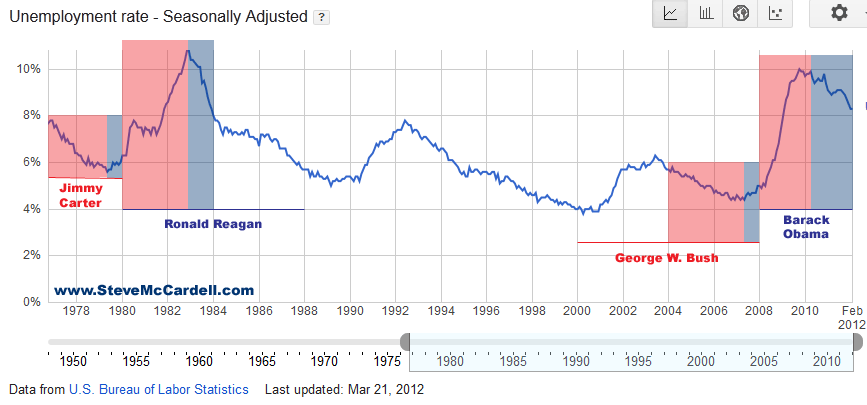
Knowing that, it's still interesting that unemployment was declining most of the time under Jimmy Carter until the last few months before the election, then went UP. Of course what this chart doesn't show is the fact that INFLATION was up to around 13% by the time of the election and was the primary point on people's minds.
Once Reagan got into office, it took 3 YEARS to stop the increase in unemployment. In that time, inflation dropped to around 3%. Officially, inflation's been pretty steady since then, with a short dip into NEGATIVE territory in 2009.
Meanwhile, in the last 4 years of George W. Bush, unemployment was mostly declining until the very end when it began to climb just before the election. Much what happened when Carter was in office. Officially, it took just over two years with Obama in office before this began to reverse.
(This is a good example of how skewed the numbers may actually be. By the end of 2007, we already knew a lot of people in the Detroit area losing their jobs, and I think a lot of the country knew what was happening well before the numbers in the chart began to skyrocket.)
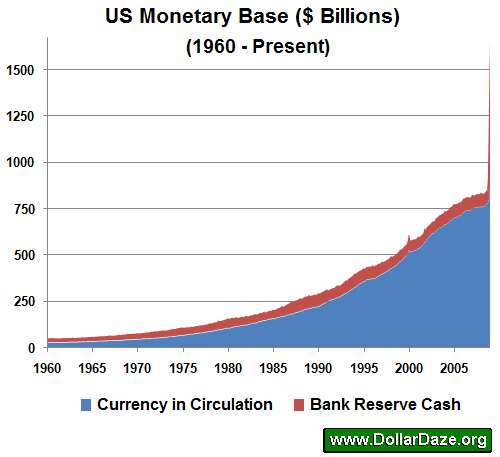
Now there's a lot of concern about the increase in MONEY SUPPLY (M0 -- Currency in Circulation) in the last few years, but let me point out another interesting fact.
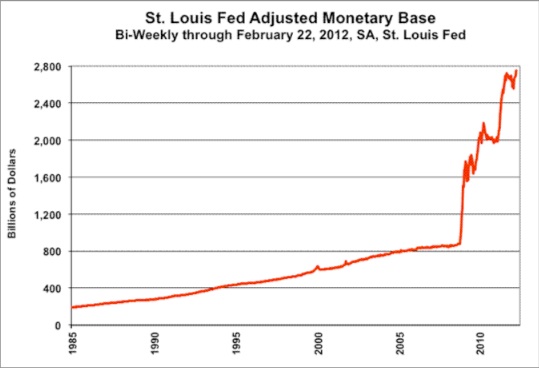
Now let's see how it has spiked in the last few years:
While the Monetary Base "only" grew from about $600 billion to $800 billion in George W's first 4 years, and was steady just about till the end of his presidency, its surge began when he was still in office, leaping in a matter of weeks from $850 billion to $1.75 trillion. So the rate of growth in his last 4 years was about 100%, much like Carter's. (Can't blame Obama for that -- although I know, there's always SOMEONE on the other side to blame, no matter who is president.)
In his first 4 years as president (with still a few months left), Obama has seen another trillion dollars added to the Monetary Base, or just under 60%. Almost identical to what happened under Reagan.
Increase in National Debt
DEBT UNDER CARTER:
Increased about $287 billion, or about 45%.
DEBT IN FIRST 4 YEARS OF REAGAN:
Increased about $665 billion, or about 73%
DEBT IN NEXT 4 YEARS OF REAGAN:
Increased about $1.03 trillion, or about 66%.
DEBT IN LAST 4 YEARS OF GEORGE W. BUSH:
Increased about $2.65 trillion, or about 36%.
DEBT IN FIRST 4 YEARS OF OBAMA:
Increased about $6 trillion, or about 60%. (With a few months to go. Maybe he'll catch up with Reagan.)
I know there are so many stats we could look at to make all sorts of interesting points. Chief among them I suppose would be the KIND of spending. Obama, for instance, is no doubt spending most of his money on social programs while Reagan was building a strong national defense. So we can rest assured that the two are very different in their approach. Never mind comments like this seen elsewhere:
"The fiscal year 2012 budget request of $553 billion [Note: for military] is approximately the same level as Ronald Reagan’s FY 1986 budget." [In adjusted dollars.]
[Added comment]: Of course our overall budget is higher, but the point above is that we haven't reduced effective military spending. In fact, the military budget has slightly increased (over Bush spending) under Obama.
[Second added comment]: Bank bailouts? Me, I'm not a big fan. But the last time we bailed out banks with federal dollars (before Obama) ... hmm ... that was under Reagan, who signed the Garn–St. Germain Depository Institutions Act in 1982, which led to the Savings & Loan crisis.
Sooooo ... is Barack Obama the next Ronald Reagan? Undoubtedly not. I'm sure we can all find ways to assure ourselves on this point. If nothing else ... we're operating on a far vaster scale than we were in the 1980s.


 RSS Feed